Week 6 – Mobile Analytics
February 10, 2015
This week’s readings cover mobile analytics, which for me is a fun topic, as it’s a convergence of new technologies, user behavior, data capture/analysis, and how to best activate all of this exciting engagements with new and potential guests.
The first reading from Cisco’s report wasn’t too surprising on the adoption of mobile devices and data. The 5 year CAGR could potentially be understated as growth and adoption of smartphones and other infrastructure improvements reduces the barriers data access. An article last month by Smart Insights shows that 2014 was the first year mobile surpassed desktop Internet usage and all indicators suggest this trend will continue.
Google’s article for GA reporting of app data is interesting to me, as it’s still fairly new to Google Analytics. While working on a custom app for SeaWorld’s Antarctica: Empire of the Penguin, we struggled with finding a solution that met our needs, albeit we’re a premium customer of Google. Our solution resulted in us using Flurry Analytics for our attraction app, and supplemented GA with App Annie when we relaunched our park apps last year.
This serves as a great segway for me into the article about mobile advertising vs. creating a mobile app. The Antarctica project I referenced above was an effort of activating consumers with their mobile devices. We built the app to support iOS phone and tablet, as well as Android phones. We estimated the ROI of the app to be stronger than our normal ROAS for media, as part of an overall roadshow to promote the park’s newest attraction.
Additionally, we used short URLs and QR codes as part of this campaign that allowed us to tag and measure different pieces of show/marketing collateral. While we used QR codes, it was understood that they’re somewhat of a niche usage within the mobile consumer base, which is why we always included a URL or short URL in conjunction with the CTA:
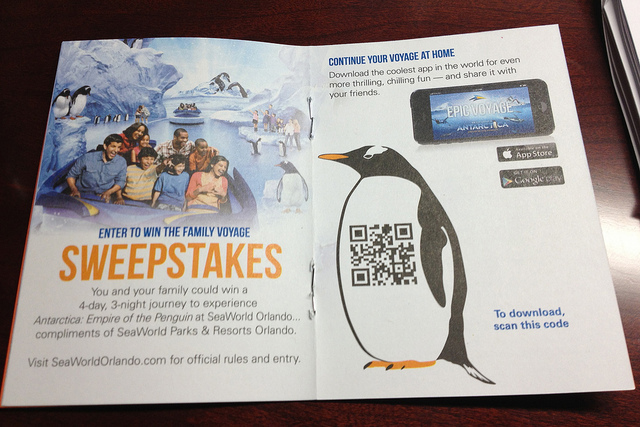

We even went so far as to add a QR code to the construction fence in the park. All the codes/URLs were set with a software provided by ScanLife which allowed us to do device/software detection to then render the guest the appropriate version of the app. For example, a guest entering the URL or scanning the code on an iPhone would get the Apple Store, vs. an Android user receiving the Google Play marketplace.
Overall, I love mobile technology and designing for the mobile user experience. Both professional data and that provided in this week’s readings reiterate that mobile is the growth sector for user engagement and brand/companies should be doing everything in their power to harness and develop the channel for their user base.
Questions:
- What type of user data would be of interest from a mobile consumer base?
- QR codes, do you love them or hate them? Where do you think they fit into the mix?
Post Tags:
App, App Data, App Performance, Google Analytics, MMC5427, Mobile Analytics,